Abstract
I introduce MAD-Velocity, a distance-and-derivative–based momentum strategy that extends the moving-average distance (MAD) indicator with its first- and second-order dynamics. By measuring the signed displacement of price from a 30-day moving average and its velocity and acceleration, the signal targets momentum inflection points while limiting sensitivity to transitory noise. I embed MAD-Velocity in a long-only trading framework and evaluate it against standard benchmarks on U.S. large-cap equities using systematic backtests with transaction-cost and slippage assumptions. Performance is assessed using multiple dimensions of risk and return, including the total number of trading days observed, compound annual growth rate (CAGR), Sharpe ratio, maximum drawdown (MaxDD), total return, and trade frequency. Across a broad cross-section of equities, the MAD-Velocity framework delivers consistently elevated risk-adjusted performance, underscoring its robustness beyond individual securities.
1.0 Introduction
Time-series momentum (TSMOM) has been established as a central pillar of systematic investing [1], yet classical implementations—most notably moving-average crossovers [2]—tend to lag at turning points and exhibit heightened sensitivity to transitory noise. Robust signals must account not only for displacement from trend but also for the dynamics of that displacement, thereby distinguishing persistent momentum from short-lived reversals.
Prior enhancements such as the Relative Strength Index (RSI) [3], Moving Average Convergence Divergence (MACD) [4], and higher-order filters have sought to refine trend detection, but each remains limited in its ability to consistently anticipate momentum inflections while controlling drawdown risk. This work introduces Moving Average Distance (MAD)-Velocity, a distance-and-derivative framework designed to fill this gap. By embedding the Moving Average Distance (MAD) indicator within a regime-based architecture, the model extends traditional trend-following tools to capture both displacement and its higher-order dynamics. The analysis evaluates MADVelocity systematically across a broad cross-section of U.S. large-cap equities, benchmarking against classical rules and buy-and-hold to assess its capacity for improved risk-adjusted returns while reducing downside exposure.
The contributions of this work are threefold. First, I formalize the MAD family of indicators—including its derivative terms for velocity and acceleration—within a coherent measurement framework. Second, I embed these signals in a fully specified long-only trading rule with explicit entry and exit mechanics. Third, I benchmark performance across the S&P 500, evaluating MAD-Velocity against passive and technical benchmarks to assess its ability to deliver superior risk-adjusted returns while reducing drawdowns.
3.0 Data
The empirical evaluation draws on the current S&P 500 constituents, with daily observations spanning January 2010 through December 2020. This horizon captures a decade of relative macroeconomic stability, characterized by sustained equity market expansion and persistently low inflation. By focusing on this period, the analysis establishes a controlled baseline for assessing strategy performance under conditions of steady growth, absent the extraordinary dislocations associated with financial crises or inflationary shocks. This dataset provides a consistent platform for benchmarking MAD-Velocity against classical rules and passive exposure.
Daily adjusted closing prices are employed, incorporating dividend and split adjustments to ensure total-return accuracy. The universe is defined by current S&P 500 constituents, with each equity included for the portion of its trading history available within the 2010–2020 horizon. As a result, the panel is unbalanced—some securities were not yet public during the early years of the sample—yet this design avoids survivorship bias by evaluating all constituents consistently within their observable histories. Transaction costs and execution slippage are embedded directly within the backtesting framework, ensuring that reported results approximate implementable performance rather than frictionless idealizations.
Figure 1 reports annual S&P 500 total returns from 2005 through 2024, with the interval from 2010 to 2020 highlighted to denote the evaluation period [12]. This decade was characterized by generally robust market performance.
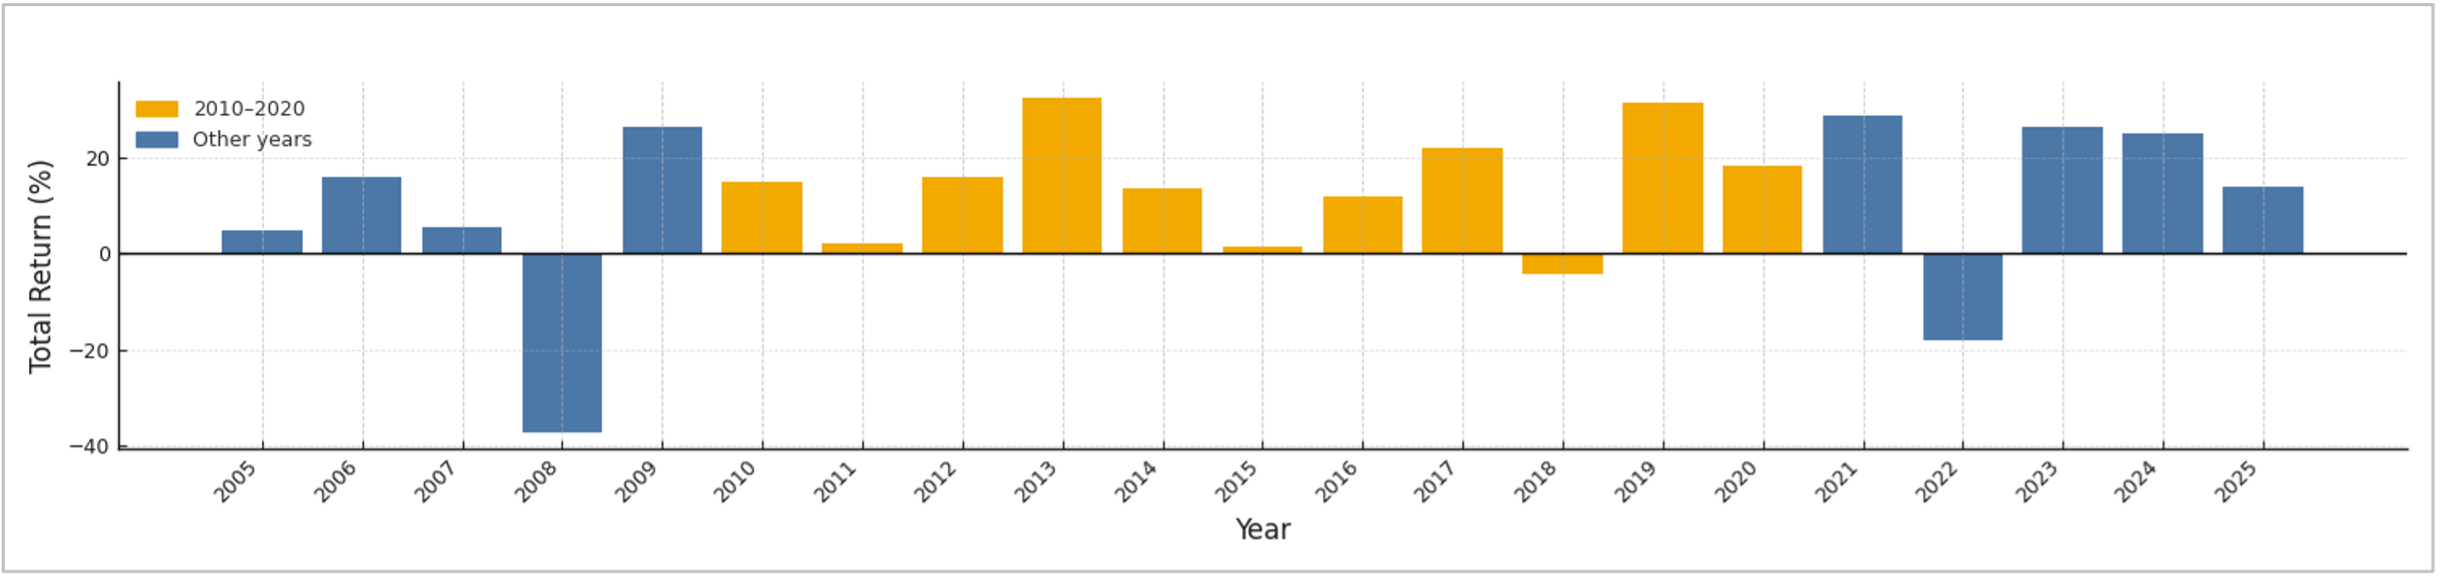
Figure 2 presents year-over-year consumer price inflation from 2005 through 2024, with the evaluation horizon (2010–2020) highlighted in blue. Inflation during this period remained consistently subdued, averaging at or below the Federal Reserve’s long-run 2% target, thereby reinforcing the macroeconomic stability of the decade under study [13].
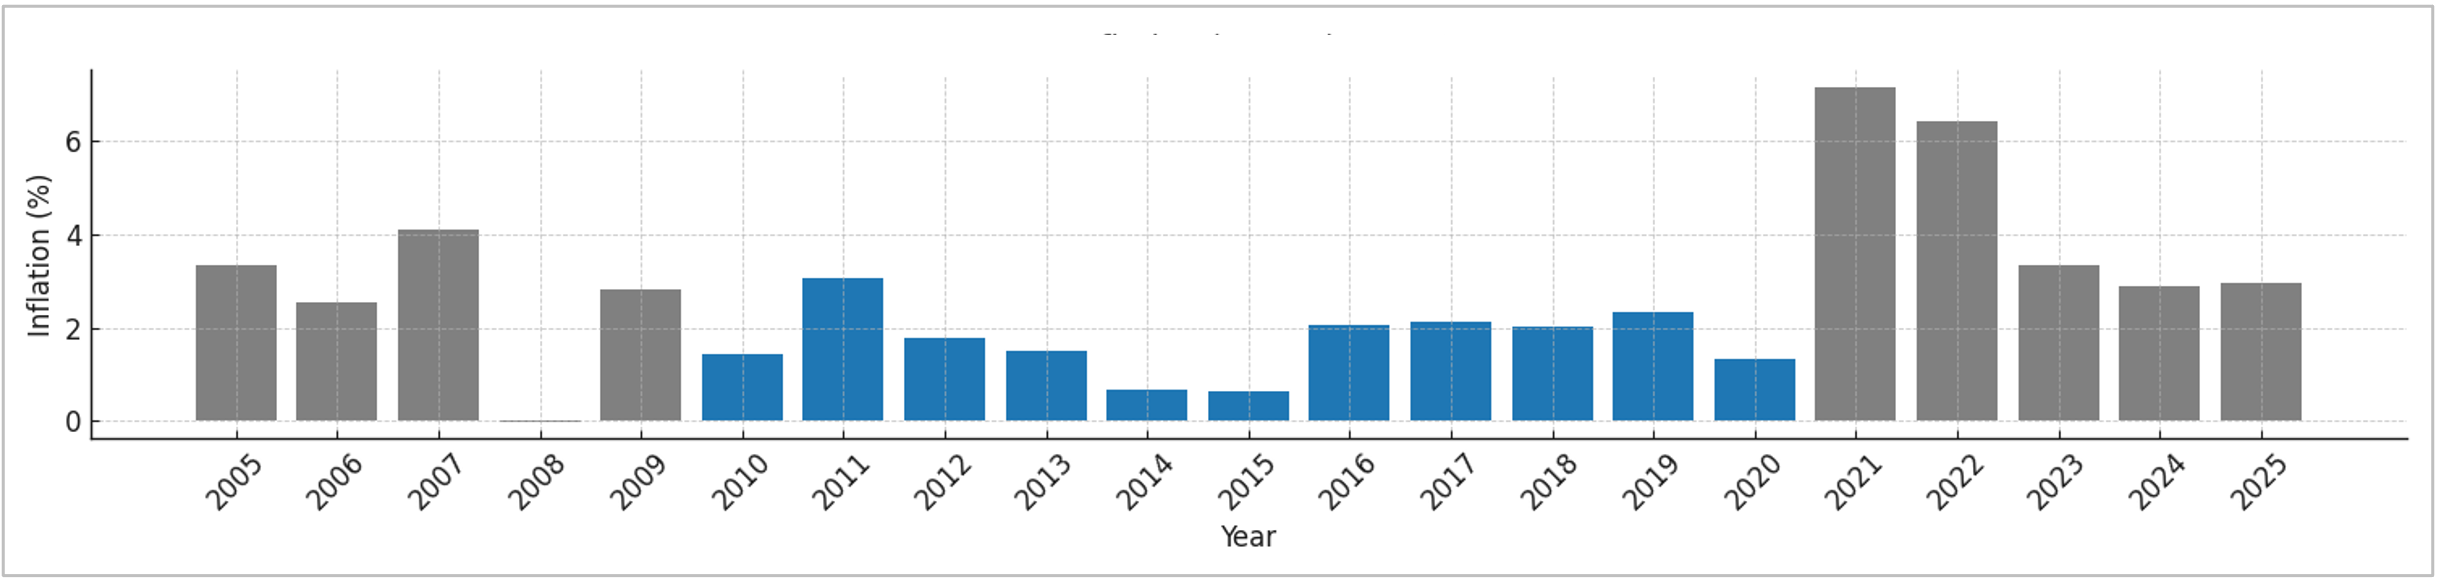
The absence of material inflationary pressures and the prevalence of stable growth conditions render the 2010– 2020 horizon a natural testbed for isolating the efficacy of MAD-Velocity. Establishing performance under this relatively benign macroeconomic backdrop provides a controlled benchmark from which subsequent research can extend the analysis to more volatile or inflation-sensitive regimes.
4.0 Methodology
The MAD-Velocity framework is designed to generate systematic trading signals by quantifying deviations from trend and modeling their dynamics. It integrates three components: first, the MAD which measures the signed displacement of price from its short-term trend; second, the first derivative of MAD, or Velocity, which captures the rate of change in that displacement; and third, the second derivative, or Acceleration, which reflects curvature in the trajectory of price deviations. Taken together, these components provide a structured representation of momentum inflections and form the foundation for the trading rules evaluated in this study
4.1 Moving Average Distance
The MAD is introduced as a standardized measure of deviation from equilibrium, designed to integrate insights from both trend-following and mean-reversion paradigms. MAD quantifies the relative displacement of an asset’s price from its 30-day simple moving average, expressed as a percentage of price:
where Pt denotes the daily closing price of the asset and SMAt represents the rolling n-day simple moving average. By construction, MAD yields a dimensionless and interpretable signal of relative extension, with positive values indicating overpricing relative to trend and negative values indicating underpricing.
Building on this foundation, I extend the MAD by incorporating its first and second derivatives. The Velocity term captures the rate at which price diverges from its moving average, while the Acceleration term measures the curvature of this divergence. Together, these dynamic extensions enhance the informational content of MAD, allowing the framework to emphasize momentum inflection points rather than static levels of displacement.
To assess the explanatory power of the MAD relative to established technical indicators, I compute Pearson correlations between technical features and returns at horizons of one, three, five, ten, fifteen, and thirty days. The feature set spans a broad range of indicator families, including classical trend measures (SMA, EMA, MACD), momentum oscillators (RSI, Stochastics), volatility-based metrics (ATR, Bollinger Bands), and volume-derived signals (OBV, CMF), complemented by the custom MAD suite. All calculations are implemented using TA-Lib with bespoke extensions. The results demonstrate that MAD consistently exhibits strong correlations with returns. In particular, the 30-day MAD achieves correlations exceeding 0.80–0.90 at the ten- and fifteen-day horizons. Moreover, The MAD’s velocity contributes predictive content for detecting inflection points, enriching the information set beyond static displacements.
A representative subset of the correlation matrix is reported in Table 1, with the full matrix available on GitHub
| Indicator | 1-Day Return | 3-Day Return | 5-Day Return | 10-Day Return | 15-Day Return | 30-Day Return |
|---|---|---|---|---|---|---|
| SMA (30) | -0.011 | -0.019 | -0.024 | -0.033 | -0.039 | -0.042 |
| SMA (50) | -0.011 | -0.019 | -0.025 | -0.035 | -0.043 | -0.054 |
| RSI (14) | 0.321 | 0.521 | 0.629 | 0.753 | 0.784 | 0.739 |
| MACD | 0.026 | 0.102 | 0.181 | 0.339 | 0.424 | 0.474 |
| MAD (30) | 0.317 | 0.528 | 0.654 | 0.827 | 0.898 | 0.840 |
| MAD (30) Vel. | 0.569 | 0.297 | 0.209 | 0.113 | 0.069 | 0.008 |
| MAD (30) Accel. | 0.402 | -0.011 | -0.007 | -0.003 | -0.003 | -0.005 |
View Full Correlation Analysis
4.2 MAD-Velocity Model
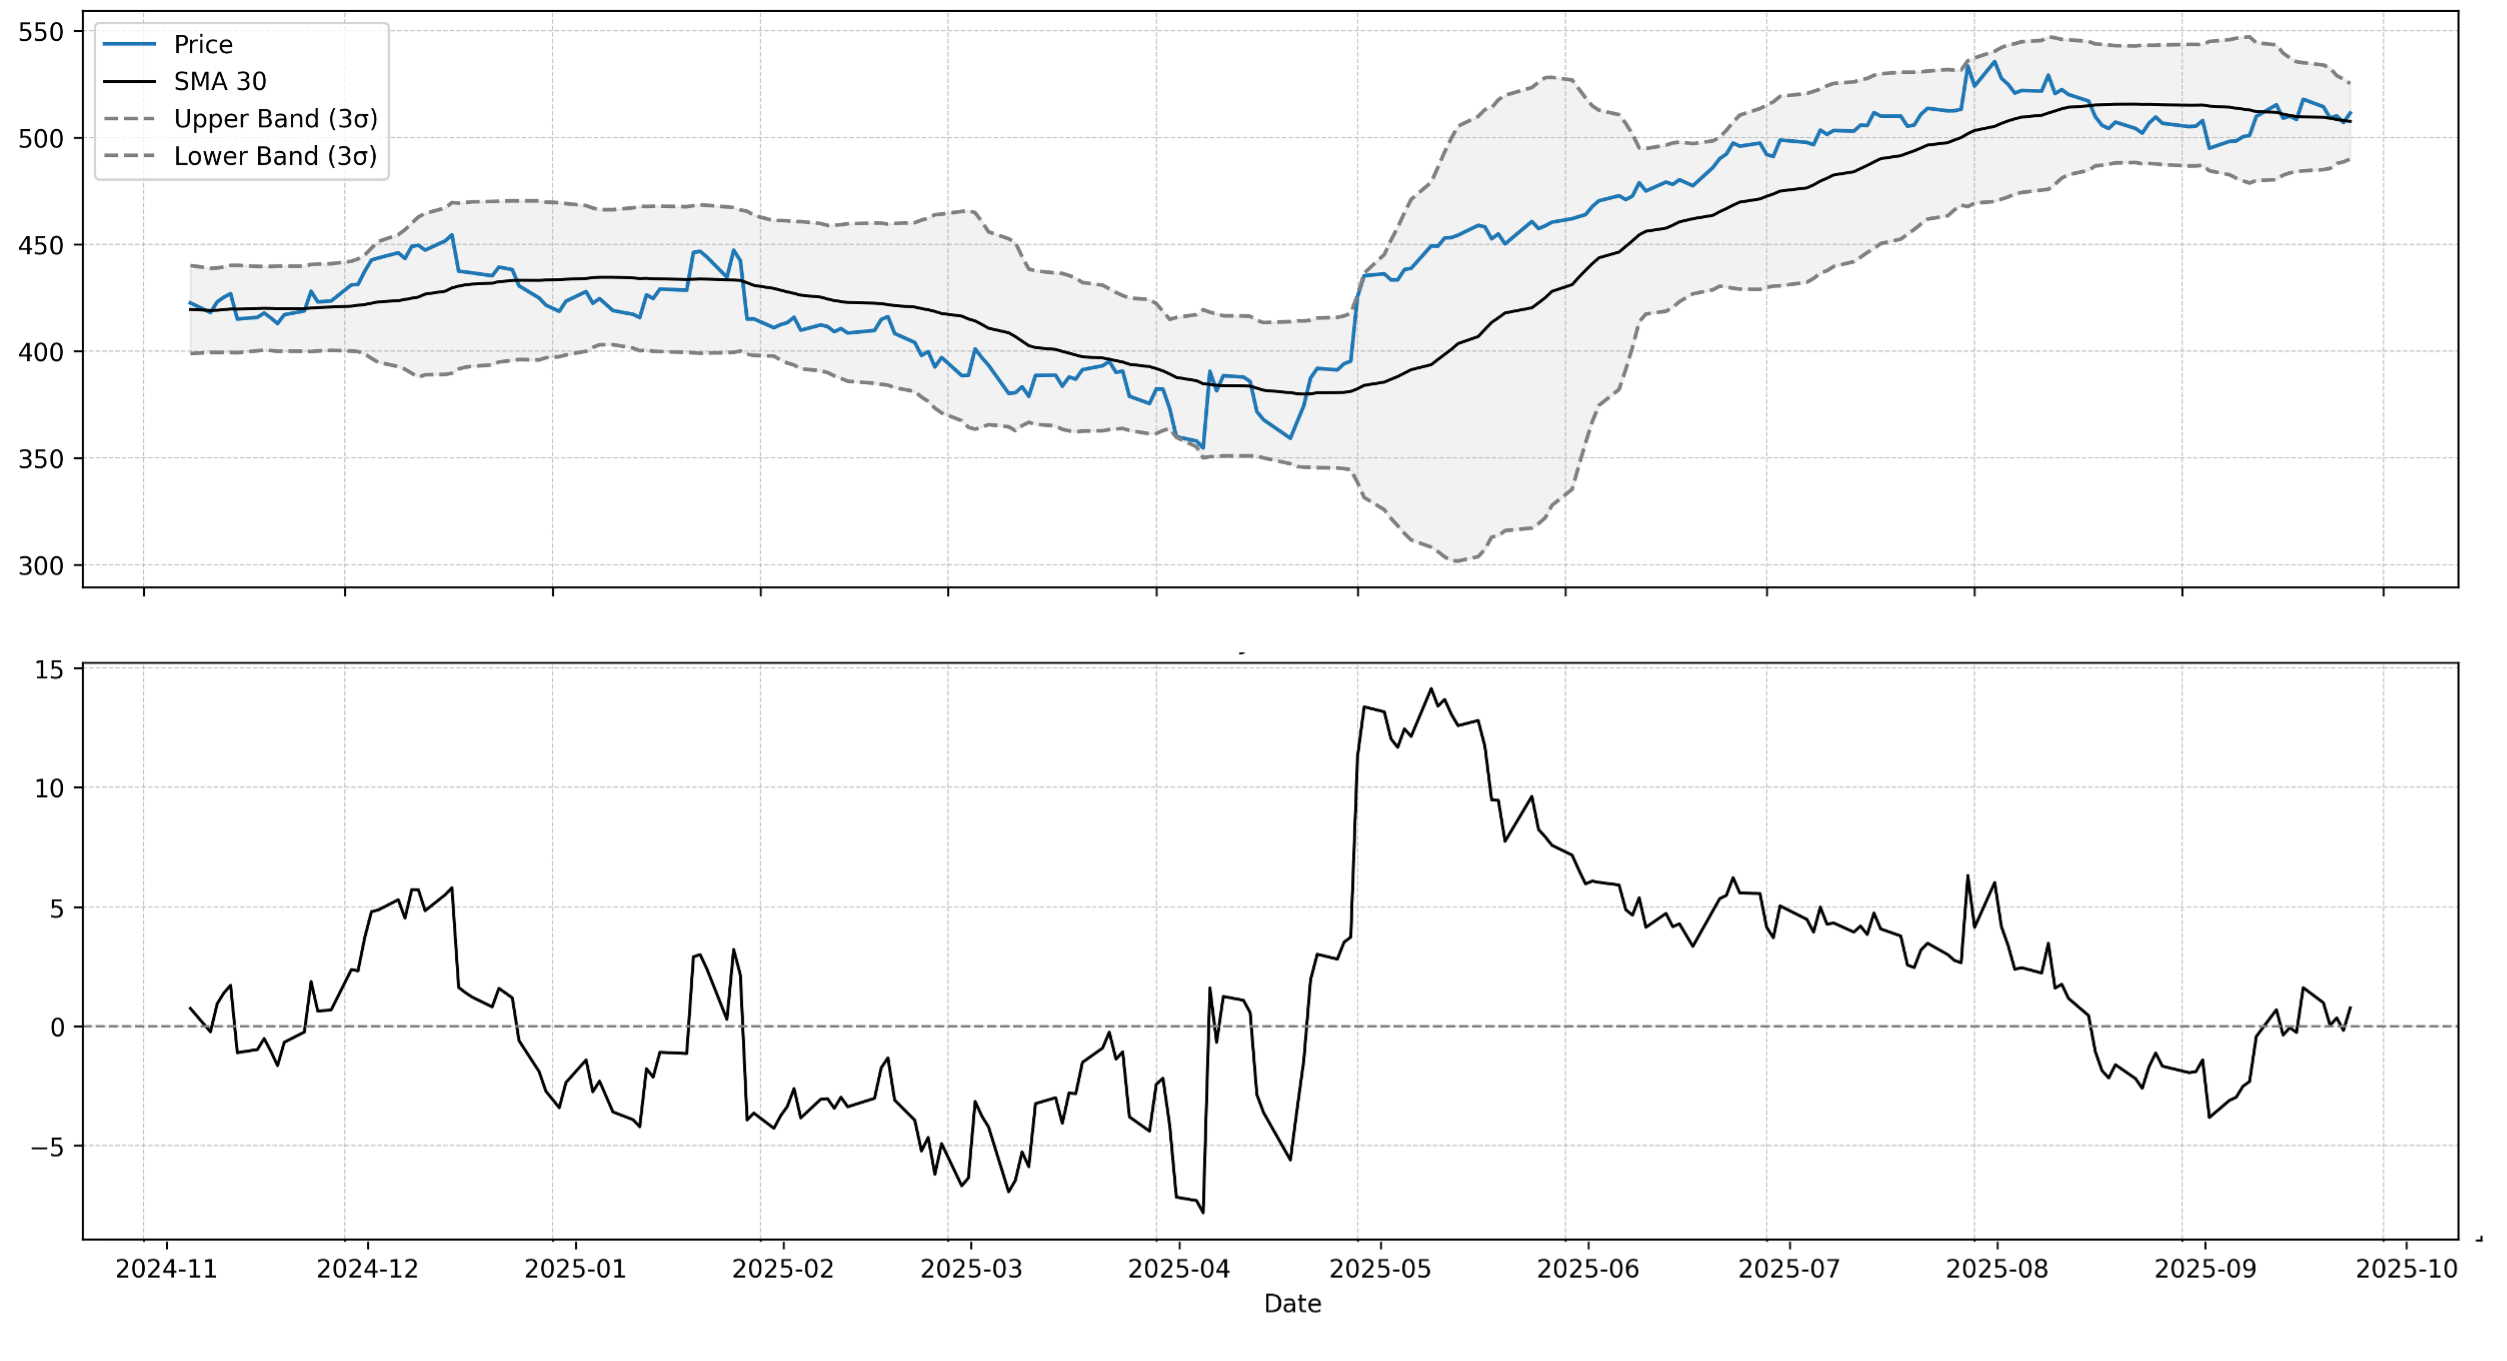
The MAD provides a standardized measure of price displacement relative to its short-term trend. Figure 3 illustrates Microsoft (MSFT), plotting daily closing prices alongside the 30-day simple moving average (SMA30) and the corresponding MAD series. By construction, MAD expresses deviations as a percentage of price, yielding a dimensionless and interpretable measure of overextension. Positive values indicate the asset is trading above its SMA30, consistent with momentum persistence and potential temporary overheating. Negative values indicate prices below trend, signaling relative weakness or mean-reversion pressure. This formulation enables systematic detection of dislocations from equilibrium and provides a quantitative lens through which to assess the magnitude and dynamics of local momentum regimes.
4.3 MAD-Velocity Strategy
A Markov chain provides a probabilistic framework for modeling the evolution of a system across discrete states, where transitions depend only on the current state. In financial applications, this permits market dynamics to be represented as regime-switching processes, such as oscillations between overbought and oversold conditions.
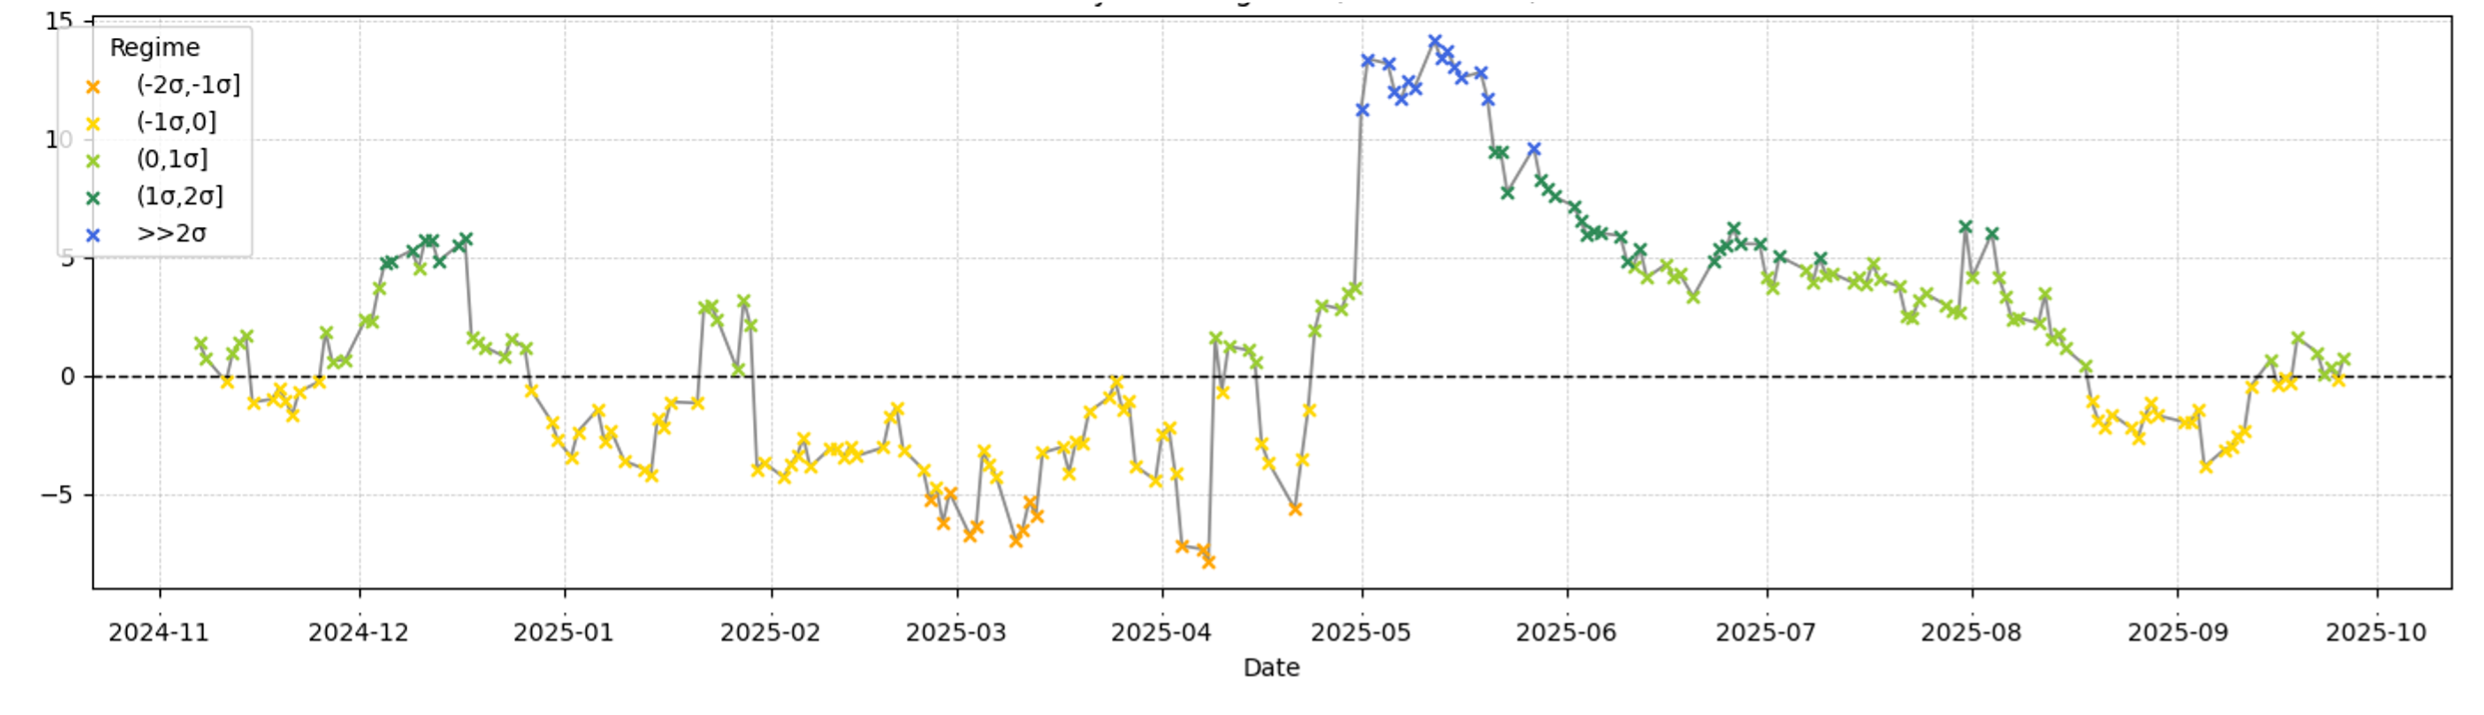
To extend the MAD framework, I discretize the 30-day MAD into regimes defined by standard deviation thresholds: values less than −2σ, between −2σ and −1σ, between −1σ and 0, between 0 and +1σ, between +1σ and +2σ, and greater than +2σ. Each trading day is thus mapped into a discrete regime, and the observed sequence of these classifications forms a Markov chain.
| X | Regime −2: MAD ≤ −2σ (red) | X | Regime 1: 0 < MAD ≤ 1σ (light green) |
| X | Regime −1: −2σ < MAD ≤ −1σ (orange) | X | Regime 2: 1σ < MAD ≤ 2σ (dark green) |
| X | Regime 0: −1σ < MAD ≤ 0 (yellow) | X | Regime 3: MAD > 2σ (blue) |
Each trading day is thus mapped into a discrete regime, with the resulting sequence forming a Markov chain. This construction enables estimation of transition probabilities across local momentum states, capturing the likelihood of reversion toward equilibrium versus continuation of trend. In doing so, the framework provides a structured, probabilistic representation of how prices migrate across regimes of relative strength and weakness. Figure 4 illustrates an example of the Markov chain applied to the 30-day MAD of Microsoft (MSFT).
4.4 Strategy Signals
The trading strategy operationalizes the 30-day MAD by partitioning values into six discrete regimes, each defined relative to long-run equilibrium (0) and expressed in units of standard deviation (σ). A long entry is initiated when the MAD transitions upward from Regime 0 (−1σ to 0) into Regime 1 (0 to +1σ), corresponding to the onset of positive momentum as price recovers above its 30-day mean. Positions are exited when extended strength begins to normalize, specifically on transitions from Regime 2 (+1σ to +2σ) back into Regime 1, thereby capturing the initial cooling phase of overextended rallies.
The strategy is long-only, and signals are executed at the next day’s open, ensuring that the rule is implementable in realistic backtesting conditions. This design systematically exploits recoveries from relative underperformance while managing exit discipline to mitigate drawdowns.
Evaluation is performed on a representative cross-section of S&P 500 constituents using daily split- and dividendadjusted prices from January 2010 through December 2020, sourced from Yahoo Finance. Benchmarks include the 30-day SMA and the baseline 30-day MAD. Performance is assessed along multiple dimensions of risk and return, including final equity value, compound annual growth rate (CAGR), annualized Sharpe ratio (daily mean excess return divided by daily standard deviation, scaled by √252), maximum drawdown, and trade frequency.
5.0 Results
The MAD-Velocity strategy was evaluated across 488 S&P 500 constituents between January 2010 and January 2020. The number of equities is slightly below the full index membership because several tickers failed to return complete price histories from Yahoo Finance, resulting in exclusion from the dataset. The strategy produced equity-like returns in aggregate, with an average compound annual growth rate (CAGR) of 9.5% and a median of 8.8%. Risk-adjusted performance was moderate but consistent, with both the mean and median Sharpe ratio equal to 0.54, reflecting steady alpha capture over the evaluation horizon. Drawdown profiles exhibited considerable dispersion: the largest maximum drawdown exceeded −92%, while the most resilient constituent experienced a decline of only −14%. On average, cumulative returns were approximately 2.75×, with a median of 2.24×, suggesting that the strategy generally preserved capital while compounding positively.
In terms of trading activity, the strategy was long-only and maintained at most one position per ticker at any given time. Over the ten-year horizon, average turnover amounted to 24 trades per security, with a median of 25 trades, corresponding to roughly two to three trades per year on a typical equity. This relatively low activity is consistent with the framework’s design, which emphasizes infrequent but decisive entries and exits linked to regime transitions in the 30-day Moving Average Distance (MAD). While mean outcomes were broadly favorable, dispersion across individual securities was substantial. High-growth technology firms such as AMZN, NVDA, and PAYC achieved compound annual growth rates in excess of 20%, whereas several industrial and energy names produced muted or negative equity curves. This cross-sectional variation underscores the dependence of MADVelocity’s efficacy on underlying volatility regimes and sectoral dynamics.
Taken together, the evidence suggests that the MAD-Velocity strategy systematically captures medium-horizon reversals and momentum transitions across a broad cross-section of U.S. equities. While drawdown risk remains nontrivial at the individual-ticker level, this is characteristic of equity strategies more generally and is partially mitigated by the framework’s disciplined entry and exit mechanics. On average, performance metrics align closely with the strategy’s stated objective: compounding returns by participating in recoveries from oversold regimes while exiting positions as momentum normalizes from overextended levels. These findings provide empirical support for the regime-based construction of MAD-Velocity and validate its role as a structured alternative to conventional trend-following rules.
5.1 Top Total Returns
| Ticker | Days | CAGR | Sharpe | MaxDD | Total Return | Trades |
|---|---|---|---|---|---|---|
| PAYC | 1438 | 0.694 | 1.707 | -25% | 2027% | 15 |
| NXPI | 2366 | 0.315 | 0.947 | -50% | 1312% | 25 |
| FTNT | 2515 | 0.286 | 0.996 | -48% | 1229% | 27 |
| FICO | 2515 | 0.273 | 1.149 | -34% | 1114% | 29 |
| AVGO | 2515 | 0.269 | 1.037 | -27% | 1083% | 36 |
| DXCM | 2515 | 0.269 | 0.785 | -59% | 1082% | 22 |
| MTCH | 2515 | 0.263 | 0.887 | -62% | 1031% | 19 |
| TTD | 824 | 1.023 | 1.567 | -34% | 1004% | 11 |
| NFLX | 2515 | 0.254 | 0.735 | -83% | 957% | 21 |
| AMZN | 2515 | 0.254 | 1.051 | -32% | 956% | 34 |
6.0 Conclusion and Future Work
This study introduced MAD-Velocity, a regime-based trading framework that extends the MAD indicator with first- and second-order dynamics. By discretizing deviations from a 30-day moving average into standardized regimes, the model provides a systematic method for identifying momentum inflection points and generating rule-based trading signals.
Empirical evaluation across the S&P 500 from 2010 to 2020 demonstrates that MAD-Velocity delivers competitive returns relative to passive benchmarks while enforcing disciplined entry and exit mechanics. The strategy’s ability to capture recoveries from oversold conditions and systematically exit during the cooling phase of momentum underscores the value of embedding higher-order features into distance-from-trend measures.
Results further indicate that MAD-Velocity produces favorable risk-adjusted return distributions compared to widely used technical indicators such as RSI and MACD. At the same time, performance heterogeneity across sectors highlights the importance of integrating regime-based signals with complementary filters, such as volatility scaling, volume confirmation, or cross-asset overlays, to enhance robustness.
Future work proceeds along three avenues. First, extending the analysis across multiple macroeconomic cycles would establish robustness under varying inflationary and liquidity conditions. Second, embedding MAD-Velocity within a portfolio context would clarify its diversification potential alongside other systematic strategies. Third, integrating machine-learning methods to refine regime transition probabilities offers a promising path for improving predictive accuracy.
To bridge research and practice, this site hosts a live implementation of the MAD-Velocity strategy. The platform continuously ingests real-time equity data, computes MAD-based regimes, and generates actionable trading signals. By moving beyond historical backtests, this deployment provides ongoing empirical validation and demonstrates the practical applicability of MAD-Velocity as a systematic trading framework.
References
[1] T. J. Moskowitz, Y. H. Ooi, and L. H. Pedersen, “Time series momentum,” Journal of Financial Economics, vol. 104, no. 2, pp. 228–250, 2012.
[2] W. Brock, J. Lakonishok, and B. LeBaron, “Simple technical trading rules and the stochastic properties of stock returns,” The Journal of Finance, vol. 47, no. 5, pp. 1731–1764, 1992.
[3] J. W. Wilder, New Concepts in Technical Trading Systems. Greensboro, NC: Trend Research, 1978.
[4] G. Appel, Technical Analysis: Power Tools for Active Investors. Upper Saddle River, NJ: Financial Times Prentice Hall, 2005.
[5] N. Jegadeesh and S. Titman, “Returns to buying winners and selling losers: Implications for stock market efficiency,” The Journal of Finance, vol. 48, no. 1, pp. 65–91, Mar. 1993.
[6] W. F. M. De Bondt and R. Thaler, “Does the stock market overreact?,” The Journal of Finance, vol. 40, no. 3, pp. 793–805, Jul. 1985.
[7] C. Asness, T. J. Moskowitz, and L. H. Pedersen, “Value and momentum everywhere,” The Journal of Finance, vol. 68, no. 3, pp. 929–985, Jun. 2013.
[8] J. Bollinger, Bollinger on Bollinger Bands. New York, NY: McGraw-Hill, 2001.
[9] C. L. Keltner, How to Make Money in Commodities. New York, NY: Commodities Research Bureau, 1960.
[10] A. W. Lo and A. C. MacKinlay, A Non-Random Walk Down Wall Street. Princeton, NJ: Princeton University Press, 1999.
[11] R. Cont, “Empirical properties of asset returns: stylized facts and statistical issues,” Quantitative Finance, vol. 1, no. 2, pp. 223–236, 2001.
[12] Slickcharts, “S&P 500 total returns by year,” [Online]. Available: https://www.slickcharts.com/sp500/returns
[13] Federal Reserve Bank of St. Louis, “Consumer Price Index for All Urban Consumers: All Items in U.S. City Average (CPIAUCSL),” U.S. Bureau of Labor Statistics. [Online]. Available: https://fred.stlouisfed.org/series/CPIAUCSL